Ethereum
Solana Price Surges Above Ethereum as Bullish Traders Build $2.1 Billion in Positions

Solana’s price hit $163 on Wednesday, July 17, its highest level in 40 trading days, with recent inflows into SOL derivatives markets suggesting further upside could follow.
Solana Price Surges Above Market Average with 35% Increase
Solana Solana’s price has seen a notable move recently, driven by a combination of internal developments and external market factors. Over the past few weeks, Solana’s price has increased significantly, reflecting growing investor confidence and the network’s continued progress.
The first leg of the Solana market rally began in late June following the announcement that two early investment firms, 3iQ Capital in Canada and VanEck in the United States, had filed for cash SOL ETFs in their jurisdictions.
Although the rally was initially muted, Solana bulls finally gained a foothold over the weekend after U.S. officials released dovish data on nonfarm payrolls and the consumer price index (CPI).

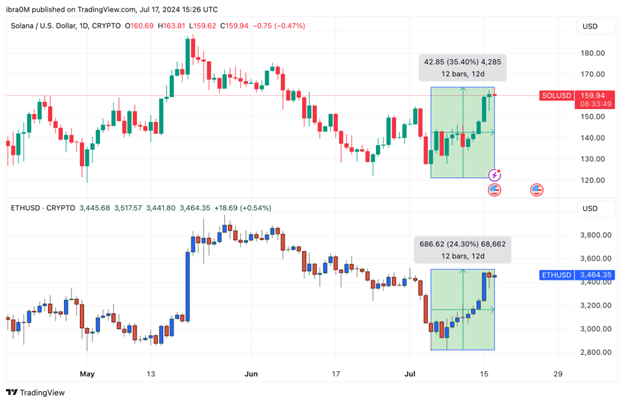
Looking at the chart above, we see how Solana’s price rose from $121 on Friday, July 5, to a daily high of $163.81 at the time of writing on July 17. This reflects a 35.40% rebound in Solana’s price over the last 12 trading days.
While the rest of the crypto markets have been trending higher this week, thanks to dovish macroeconomic speculation, Solana seems to be a standout performer. As a reminder, Ethereum’s price has only seen a 25% increase in the last 12 days, despite much wider media coverage since the announcement of the launch of ETH spot ETFs on July 23.
With Solana outperforming Ethereum by nearly 10% over the past two weeks, this suggests the presence of vital internal bullish catalysts driving SOL prices.
Solana open interest surpasses $2 billion as bullish traders take control.
One of the major internal catalysts for Solana’s recent price surge is speculation that the listing of Ethereum ETFs could significantly increase the likelihood that Solana ETFs will follow the same path in the long term. Market data trends show that many strategic traders have moved into anticipated gains on the back of this positive narrative.
For illustration, the Coinglass open interest chart below tracks real-time changes in the value of capital activity invested in Solana derivatives futures contracts.
Looking at the chart above, Solana’s open interest has now reached $2.2 billion as of press time on July 17. Notably, this marks the first time Solana’s open interest has crossed the $2.2 billion threshold in 40 days since June 7.
A closer look at the data shows that Solana’s 35% price increase over the past 12 days has far outpaced the growth in open interest, which has only increased by 22% over that time period.
When an asset’s open interest increases faster than its price, strategic investors can interpret it as a critical bullish signal for two main reasons. First, it indicates increased participation and confidence in the asset’s future price movements, suggesting that more investors are opening new positions. This increased activity often reflects positive sentiment and expectations of further price increases.
Second, higher open interest relative to price growth may indicate that traders are willing to hold their positions for longer, anticipating continued bullish momentum. This commitment to holding positions underscores a strong belief in the asset’s potential and will likely contribute to a sustained uptrend in Solana’s price as buying pressure persists ahead of the Ethereum ETF launch scheduled for July 23.
Solana Price Prediction: $180 Is The Next Target
Looking at the chart above, Solana (SOL) is showing robust bullish momentum, with the price currently sitting at $159.44. The recent 35% increase in the price over the past 12 days, accompanied by an increase in open interest, indicates strong buying interest and growing confidence among investors. Notably, the RSI (Relative Strength Index) is hovering around 60.01, indicating that even though the asset is approaching overbought territory, there is still room for improvement before reaching critical levels.
A key resistance level to watch is at $154.82, which is the .236 Fibonacci retracement level. This level was recently tested and broken, suggesting that Solana has the potential to continue its upward trajectory.
If the bullish momentum persists, the next significant resistance to watch will be at the psychological $180 level. This level not only represents round-number resistance, but it is also likely to be a critical point where profit-taking could occur.
On the downside, the main support level lies around $101.46, which is the 0.786 Fibonacci retracement level. This level has provided strong support in the past and is likely to act as a safety net in case of a pullback.
In summary, Solana’s recent market momentum suggests a bullish outlook with the next target set at $180 and an immediate support buy wall at $140. With current technical indicators pointing to continued bullish momentum and strong investor sentiment reflected by the growing open interest, Solana is well positioned for further gains.
Disclaimer: This content is informational and should not be considered financial advice. The opinions expressed in this article may include the personal opinions of the author and do not reflect the opinion of The Crypto Basic. Readers are encouraged to conduct thorough research before making any investment decisions. The Crypto Basic is not responsible for any financial losses.
-Advertisement-
